Essay
The following histogram shows average SO2 (sulfur dioxide) boiler emission rates from selected utility companies. The data was collected from a voluntary response sample of utility companies. Does the distribution depicted in the histogram reflect the true distribution of the population? Why or why not? 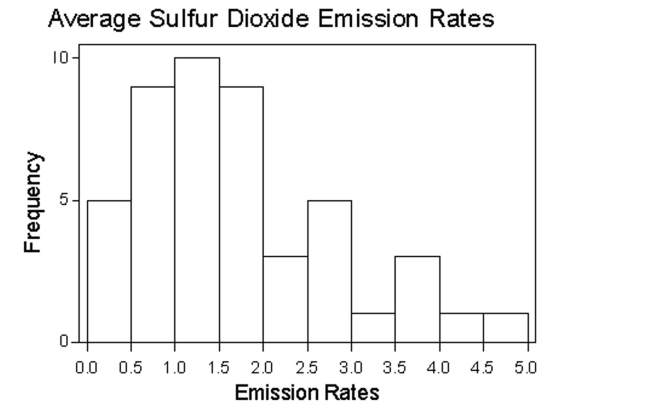
Correct Answer:

Verified
Not necessarily. The voluntary response ...View Answer
Unlock this answer now
Get Access to more Verified Answers free of charge
Correct Answer:
Verified
View Answer
Unlock this answer now
Get Access to more Verified Answers free of charge
Q52: Provide an appropriate response.<br>-Histograms and Pareto charts
Q65: Construct the cumulative frequency distribution that
Q66: Suppose that a histogram is constructed
Q67: The frequency table below shows the
Q68: The following data show the number
Q69: The following data represent the number
Q72: The attendance counts for this season's
Q73: Use the high closing values of
Q74: Construct one table that includes relative
Q75: Use the given data to construct