Multiple Choice
The following data represent the number of cars passing through a toll booth during a certain time period over a number of days.
A) 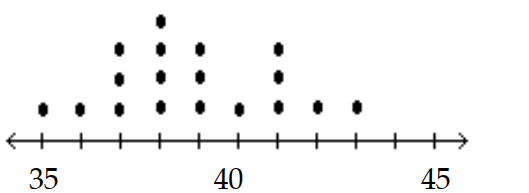
B) 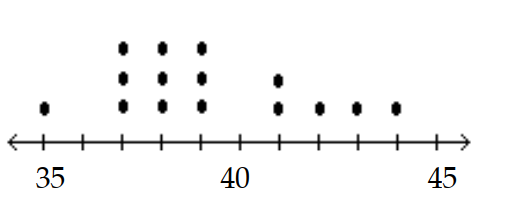
C) 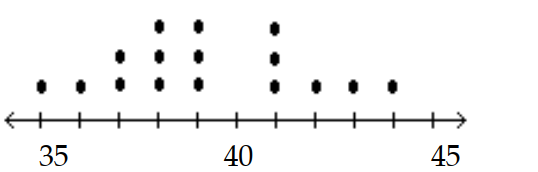
D) 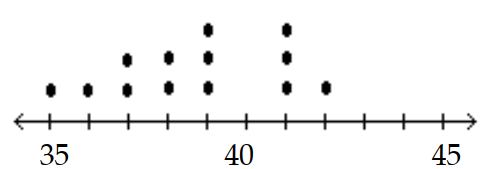
Correct Answer:

Verified
Correct Answer:
Verified
Related Questions
Q15: Solve the problem.<br>-Suppose that you construct a
Q52: Provide an appropriate response.<br>-Histograms and Pareto charts
Q65: Construct the cumulative frequency distribution that
Q66: Suppose that a histogram is constructed
Q67: The frequency table below shows the
Q68: The following data show the number
Q70: The following histogram shows average SO2 (sulfur
Q72: The attendance counts for this season's
Q73: Use the high closing values of
Q74: Construct one table that includes relative