Essay
The frequency table below shows the amount of weight loss during the first month of a diet program for a group of men. Constructing a frequency polygon. Applying a loose interpretation of the requirements for a normal distribution, do the pounds of weight loss appear to be normally distributed?
Why or why not? 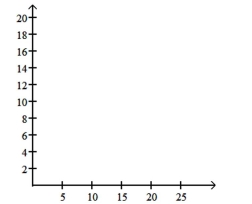
Correct Answer:

Verified
The frequency polygon appears to roughly...View Answer
Unlock this answer now
Get Access to more Verified Answers free of charge
Correct Answer:
Verified
View Answer
Unlock this answer now
Get Access to more Verified Answers free of charge
Q15: Solve the problem.<br>-Suppose that you construct a
Q52: Provide an appropriate response.<br>-Histograms and Pareto charts
Q62: A manufacturer records the number of
Q63: Using a strict interpretation of the
Q65: Construct the cumulative frequency distribution that
Q66: Suppose that a histogram is constructed
Q68: The following data show the number
Q69: The following data represent the number
Q70: The following histogram shows average SO2 (sulfur
Q72: The attendance counts for this season's