Multiple Choice
Determine which plot shows the strongest linear correlation.
A) 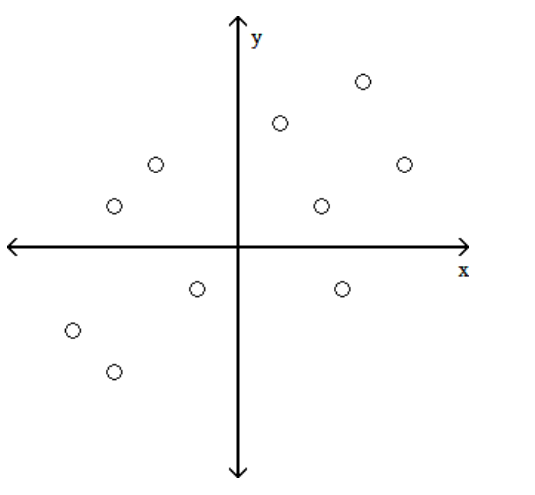
B) 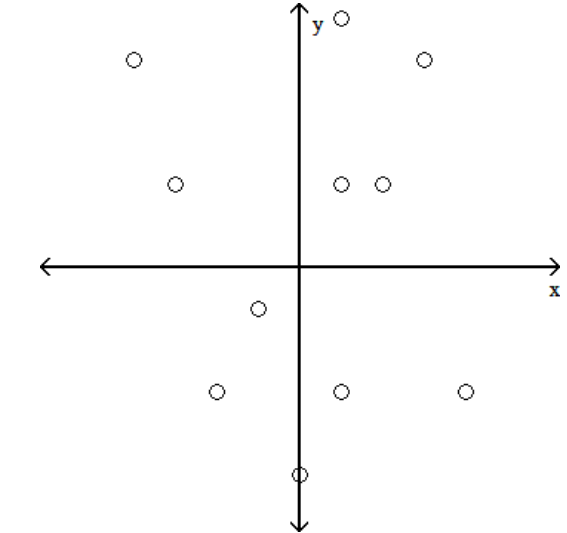
C) 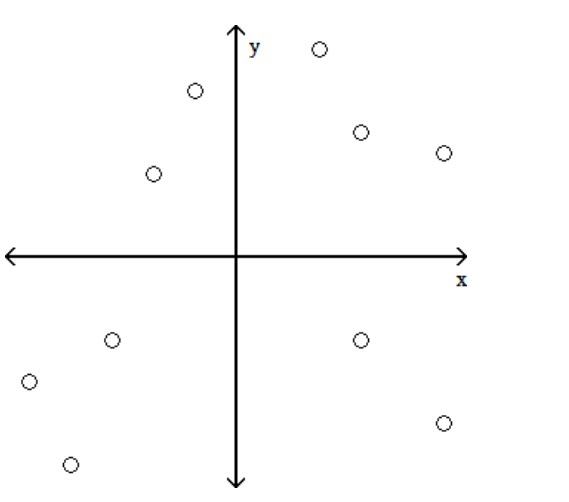
D) 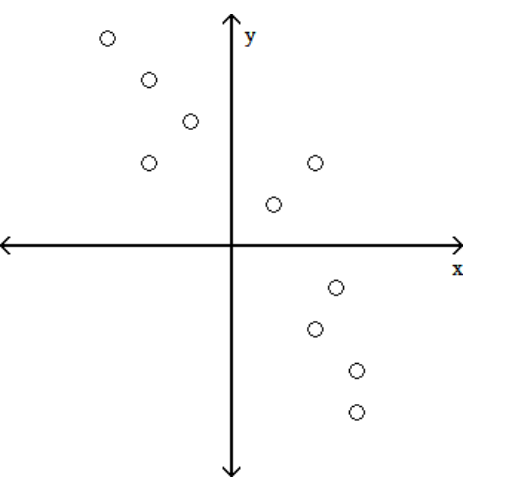
Correct Answer:

Verified
Correct Answer:
Verified
Related Questions
Q35: The following residual plot is obtained after
Q36: The following scatterplot shows the percentage
Q37: The following scatterplot shows the percentage
Q38: Is the data point, P, an outlier,
Q39: Ten trucks were ranked according to
Q41: Find the value of the linear
Q42: Use the given data to find
Q43: Discuss the guidelines under which the linear
Q44: Use the given data to find
Q45: Use the rank correlation coefficient to