Multiple Choice
The following scatterplot shows the percentage of the vote a candidate received in the 2004 senatorial elections according to the voter's income level based on an exit poll of voters conducted by CNN. The income levels 1-8 correspond to the following income classes: Under ; or more.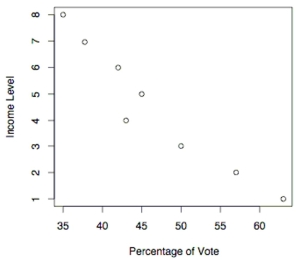
-Use the election scatterplot to the find the critical values corresponding to a significance level used to test the null hypothesis of .
A)
B) and
C)
D) and
Correct Answer:

Verified
Correct Answer:
Verified
Q32: Nine pairs of data yield
Q33: Find the value of the linear
Q34: Use the given data to find
Q35: The following residual plot is obtained after
Q36: The following scatterplot shows the percentage
Q38: Is the data point, P, an outlier,
Q39: Ten trucks were ranked according to
Q40: Determine which plot shows the strongest linear
Q41: Find the value of the linear
Q42: Use the given data to find