Essay
The bigger the stop sign, the more expensive it is. Here is a graph of the height of a sign in inches versus its cost in dollars. 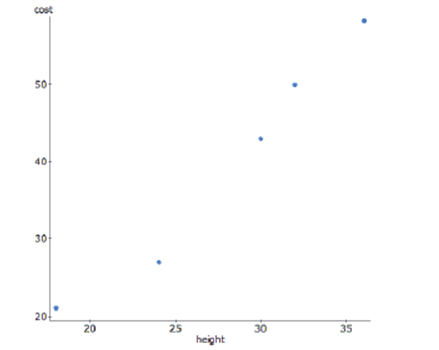
-Describe why performing linear regression with these data is not a good decision.
Correct Answer:

Verified
The data is clearly ...View Answer
Unlock this answer now
Get Access to more Verified Answers free of charge
Correct Answer:
Verified
View Answer
Unlock this answer now
Get Access to more Verified Answers free of charge
Q12: Interpret the slope of your model in
Q70: The following is a scatterplot of the
Q71: Penicillin Doctors studying how the human
Q72: A silly psychology student gathers data on
Q73: The correlation between a family's weekly income
Q76: All but one of these statements contain
Q77: Here is a scatterplot of weight versus
Q78: The bigger the stop sign, the
Q79: An article in the Journal of
Q80: Height and weight Suppose that both height