Multiple Choice
The table shows the number of minutes ridden on a stationary bike and the approximate number of calories burned. Plot the points on the grid provided then choose the most likely correlation coefficient from the answer choices below. 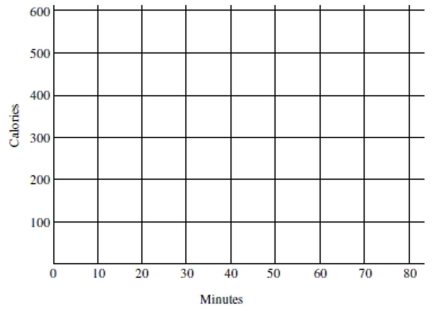
A) -0.30
B) 0.99
C) 0.30
D) -0.99
Correct Answer:

Verified
Correct Answer:
Verified
Q2: Use the following information to answer the
Q2: Based on the scatterplots below, what is
Q5: The following calculator screenshots show the scatterplot
Q7: The following regression equation was found to
Q8: The scatterplot below shows the hat size
Q9: The data in the table represent
Q10: The scatterplot below shows the number of
Q11: The scatterplot below shows the ice cream
Q33: Which of the following statements regarding the
Q36: Use the following information to answer the