Multiple Choice
The histogram below displays the distribution of the length of time on hold, for a collection of customers, calling a repair call center. Use the histogram to select the true statement. 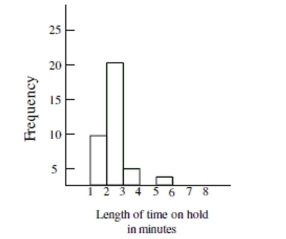
A) The distribution shows that the data was highly variable with some callers waiting on hold as
Many as 20 minutes.
B) The distribution is symmetrical. The number of callers who waited on hold for less than three
Minutes was the same as the number of callers who waited on hold for more than three
Minutes.
C) The distribution is left-skewed and most callers waited on hold at least three minutes.
D) The distribution is right-skewed and most callers waited on hold less than three minutes.
Correct Answer:

Verified
Correct Answer:
Verified
Q5: The graph below displays the number of
Q6: Describe the shape of the distribution in
Q7: Choose the histogram that matches the description.<br>-The
Q7: How many participants had a heart rate
Q8: Based on the histogram below, would it
Q13: Find the original data set from
Q14: Find the original data set from
Q15: The distribution of the numbers of times
Q47: Write a sentence to compare color preferences
Q50: What was the most common response for