Multiple Choice
The graph below displays the number of applications for a concealed weapons permit in Montcalm County, Michigan, for each of three years. A reported interprets this graph to mean that Applications in 2010 are more than twice the level in 2008. Is the reported making a correct
Interpretation? 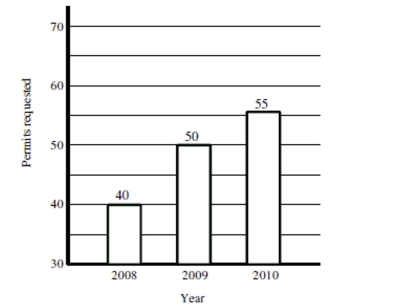
A) Yes. The bar for 2010 is twice the height of the bar for 2008 and the number of applications indicated above the bars shows that applications in 2010 are more than twice the level in 2008.
B) No. Although the 2010 bar is more than twice the height of the 2008, the bars do not begin at 0 applications, so the graph does not correctly represent the data. Fifty-five is not equal to two
Times the number of applications made in 2008.
C) No. The width of the bars is identical, indicating that the number of applications in 2010 is no different from 2008.
Correct Answer:

Verified
Correct Answer:
Verified
Q1: Data was collected on hand grip strength
Q2: The graph below displays the number of
Q3: Which of the following statements best describes
Q6: Describe the shape of the distribution in
Q7: Choose the histogram that matches the description.<br>-The
Q8: Based on the histogram below, would it
Q10: The histogram below displays the distribution of
Q44: Which type of take- out food is
Q47: Write a sentence to compare color preferences
Q50: What was the most common response for