Multiple Choice
Choose the histogram that matches the description.
-The data in the histogram summarizes the pitch speed of a sample of 75 pitches for a college pitcher during one season. Which of the following statements best describes the distribution of the Histogram below? 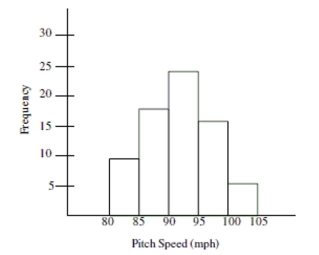
A) The distribution is right-skewed and shows that most of the pitches were more than 90 mph.
B) The distribution has a large amount of variation which can be seen by comparing the heights of the bars in the histogram.
C) The distribution is left-skewed and shows that most of the pitches were less than 95 mph.
D) The distribution is symmetric around a pitch speed of about 93 mph.
Correct Answer:

Verified
Correct Answer:
Verified
Q2: The graph below displays the number of
Q3: Which of the following statements best describes
Q5: The graph below displays the number of
Q6: Describe the shape of the distribution in
Q7: How many participants had a heart rate
Q8: Based on the histogram below, would it
Q10: The histogram below displays the distribution of
Q44: Which type of take- out food is
Q47: Write a sentence to compare color preferences
Q50: What was the most common response for