Multiple Choice
Use the circle graph to solve the problem.
-A survey of the 5589 vehicles on the campus of State University yielded the following pie chart. 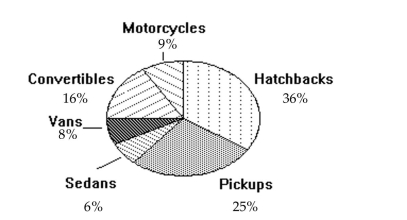 What percent of the vehicles are hatchbacks?
A) 201%
B) 8%
C) 36%
D) 25%
Correct Answer:

Verified
Correct Answer:
Verified
Q6: Use the data to create a
Q7: Provide an appropriate response.<br>-Draw one histogram
Q8: Solve the problem.<br>-Using the employment information
Q9: Construct the cumulative frequency distribution that
Q11: Solve the problem.<br>-260 casino patrons, were interviewed
Q12: Solve the problem.<br>-Wagenlucht Ice Cream Company is
Q13: Construct the cumulative frequency distribution that
Q14: Find the original data from the
Q15: Solve the problem.<br>-Suppose that you construct a
Q45: Describe at least two advantages to using