Multiple Choice
Use the data to create a stemplot.
-The following data give the distribution of the types of houses in a town containing 30,000 houses.

A) 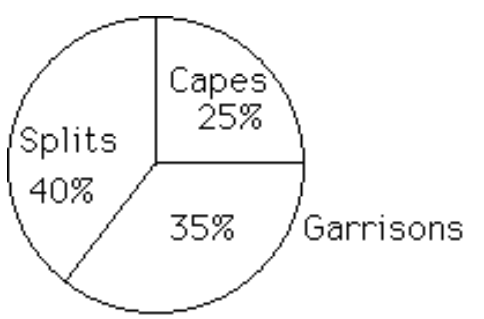
B) 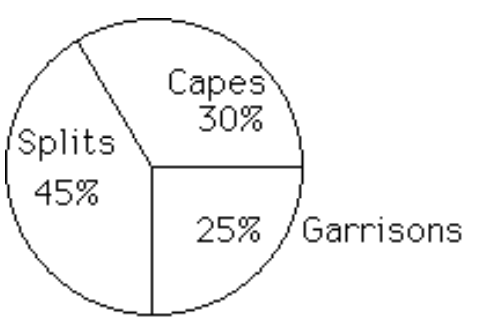
Correct Answer:

Verified
Correct Answer:
Verified
Related Questions
Q1: Construct the dot plot for the
Q2: Provide an appropriate response.<br>-Suppose you are comparing
Q3: Solve the problem.<br>-Use the high closing
Q4: Construct the dot plot for the
Q7: Provide an appropriate response.<br>-Draw one histogram
Q8: Solve the problem.<br>-Using the employment information
Q9: Construct the cumulative frequency distribution that
Q10: Use the circle graph to solve the
Q11: Solve the problem.<br>-260 casino patrons, were interviewed
Q45: Describe at least two advantages to using