Multiple Choice
Solve the problem.
-260 casino patrons, were interviewed as they left the casino. 78 of them said they spent most of the time playing the slots. 78 of them said they played blackjack. 39 said they played craps. 13 said roulette. 13 said poker. The rest were not sure what they played the most. Construct a Pareto chart to depict the gaming practices of the group of casino goers. Choose the vertical scale so that the relative frequencies are represented.
A) 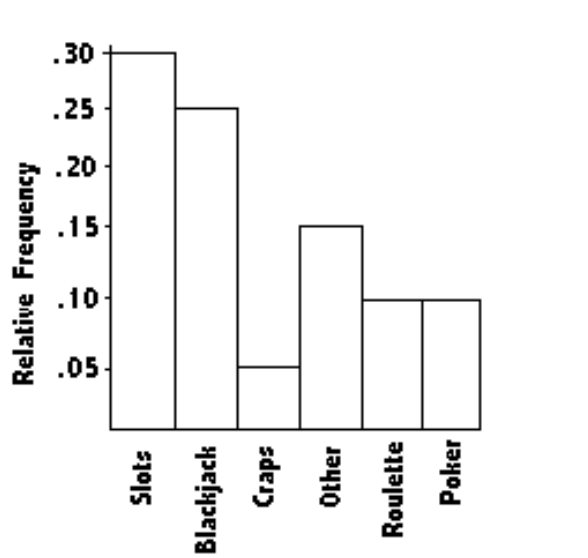
B) 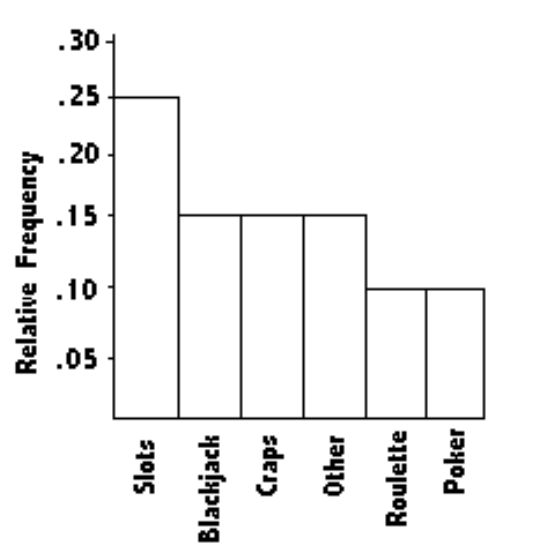
C) 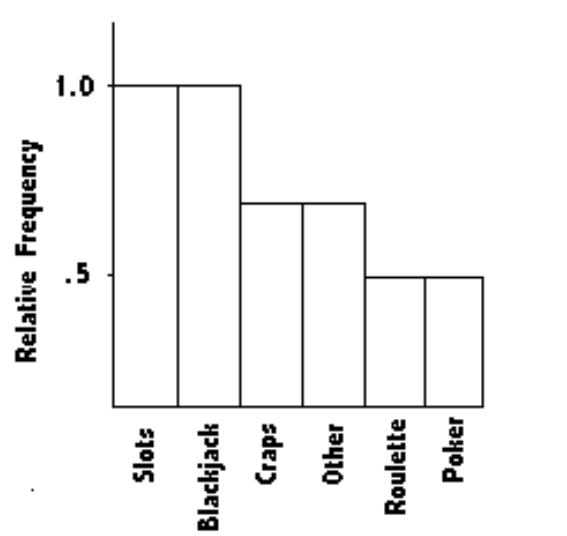
D) 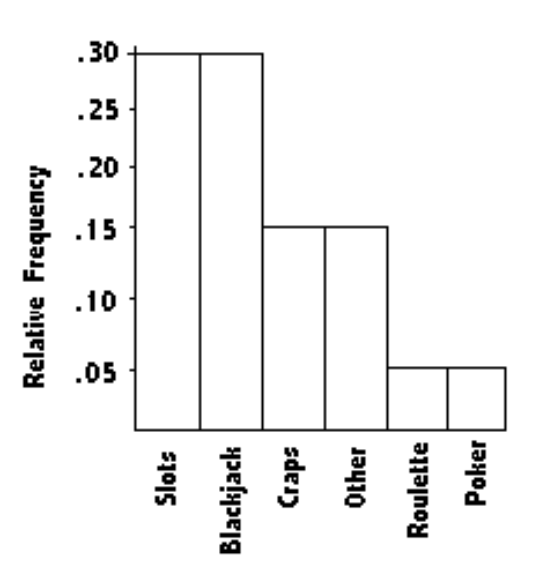
Correct Answer:

Verified
Correct Answer:
Verified
Q6: Use the data to create a
Q7: Provide an appropriate response.<br>-Draw one histogram
Q8: Solve the problem.<br>-Using the employment information
Q9: Construct the cumulative frequency distribution that
Q10: Use the circle graph to solve the
Q12: Solve the problem.<br>-Wagenlucht Ice Cream Company is
Q13: Construct the cumulative frequency distribution that
Q14: Find the original data from the
Q15: Solve the problem.<br>-Suppose that you construct a
Q16: A nurse measured the blood pressure of