Multiple Choice
The scatterplot below displays the amount of nitrous oxide (NO) explained by the amount of carbon monoxide (CO) emissions in million metric tons over a ten year period in the United
States. Select the choice that best describes any relationship between the variables. 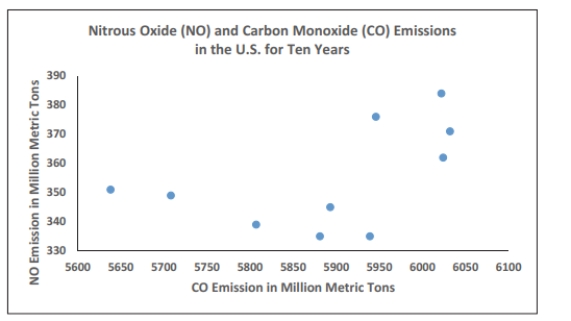
A) There is a negative linear association between NO and CO.
B) There is a positive linear association between NO and CO.
C) Overall, there is no noticeable relationship between NO and CO.
D) NO can be explained by CO.
Correct Answer:

Verified
Correct Answer:
Verified
Q4: Describe the differences between a histogram and
Q4: The frequency distribution below summarizes the
Q6: The histogram below represents the number of
Q7: The histogram below represents the number
Q8: The following data represent the number
Q10: The weights (in pounds)of 22 members
Q11: A nurse measured the blood pressure of
Q12: A nurse measured the blood pressure of
Q13: Which explained by the amount of
Q14: The following data show the number