Multiple Choice
The following data represent the number of cars passing through a toll booth during a certain time period over a number of days.
Which of these choices display the correct dotplot?
A) Number of Cars Passing Through
a Toll Booth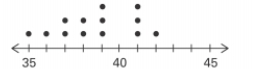
B) Number of Cars Passing Through
a Toll Booth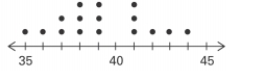
C) Number of Cars Passing Through a Toll Booth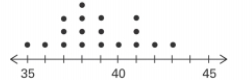
D) Number of Cars Passing Through a Toll Booth 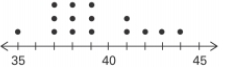
Correct Answer:

Verified
Correct Answer:
Verified
Q4: Describe the differences between a histogram and
Q4: The frequency distribution below summarizes the
Q6: The histogram below represents the number of
Q7: The histogram below represents the number
Q9: The scatterplot below displays the amount of
Q10: The weights (in pounds)of 22 members
Q11: A nurse measured the blood pressure of
Q12: A nurse measured the blood pressure of
Q13: Which explained by the amount of
Q34: A bar chart and a Pareto chart