Multiple Choice
The histogram below represents the number of television sets per household for a sample of U.S. households. What is the sample size?
Number of TV Sets Per U.S. Household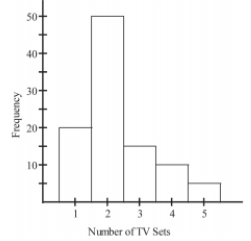
A) 5
B) 50
C) 90
D) 100
Correct Answer:

Verified
Correct Answer:
Verified
Related Questions
Q1: A nurse measured the blood pressure of
Q2: The frequency distribution below summarizes the
Q4: Describe the differences between a histogram and
Q4: The frequency distribution below summarizes the
Q7: The histogram below represents the number
Q8: The following data represent the number
Q9: The scatterplot below displays the amount of
Q10: The weights (in pounds)of 22 members
Q11: A nurse measured the blood pressure of
Q34: A bar chart and a Pareto chart