Short Answer
FIGURE 2-6 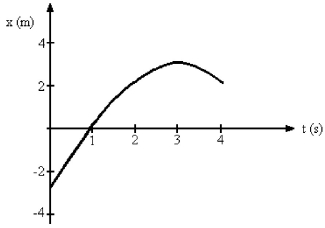
-Fig. 2-6 represents the position of a particle as it travels along the x-axis. What is the average velocity of the particle between t = 0 s and t = 3 s?
Correct Answer:

Verified
Correct Answer:
Verified
Q17: Car A is traveling at twice the
Q34: Suppose that a car traveling to the
Q36: FIGURE 2-10 <img src="https://d2lvgg3v3hfg70.cloudfront.net/TB3817/.jpg" alt="FIGURE 2-10
Q37: An object is moving with constant non-zero
Q40: FIGURE 2-6 <img src="https://d2lvgg3v3hfg70.cloudfront.net/TB3817/.jpg" alt="FIGURE 2-6
Q42: Which graph below could represent the motion
Q43: FIGURE 2-8 <img src="https://d2lvgg3v3hfg70.cloudfront.net/TB3817/.jpg" alt="FIGURE 2-8
Q44: FIGURE 2-10 <img src="https://d2lvgg3v3hfg70.cloudfront.net/TB3817/.jpg" alt="FIGURE 2-10
Q84: The average velocity of a car traveling
Q89: At the instant a traffic light turns