Multiple Choice
FIGURE 2-8 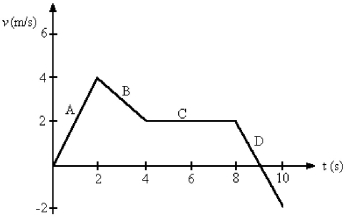
-Fig. 2-8 shows the velocity-versus-time graph for a basketball player traveling up and down the court in a straight-line path. Find the total distance run by the player in the 10 s shown in the graph.
A) 20 m
B) 18 m
C) 16 m
D) 14 m
E) 12 m
Correct Answer:

Verified
Correct Answer:
Verified
Q39: FIGURE 2-6 <img src="https://d2lvgg3v3hfg70.cloudfront.net/TB3817/.jpg" alt="FIGURE 2-6
Q40: FIGURE 2-6 <img src="https://d2lvgg3v3hfg70.cloudfront.net/TB3817/.jpg" alt="FIGURE 2-6
Q42: Which graph below could represent the motion
Q44: FIGURE 2-10 <img src="https://d2lvgg3v3hfg70.cloudfront.net/TB3817/.jpg" alt="FIGURE 2-10
Q45: FIGURE 2-2 <img src="https://d2lvgg3v3hfg70.cloudfront.net/TB3817/.jpg" alt="FIGURE 2-2
Q46: FIGURE 2-8 <img src="https://d2lvgg3v3hfg70.cloudfront.net/TB3817/.jpg" alt="FIGURE 2-8
Q47: In a relay race, runner A is
Q48: FIGURE 2-13 <img src="https://d2lvgg3v3hfg70.cloudfront.net/TB3817/.jpg" alt="FIGURE 2-13
Q84: The average velocity of a car traveling
Q89: At the instant a traffic light turns