Multiple Choice
FIGURE 2-10 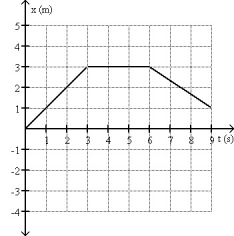
-Fig. 2-10 shows the position of an object as a function of time. What is the length of the path the object followed during the time interval from time t = 0.0 s and time t = 9.0 s?
A) -1.0 m
B) 3.0 m
C) 1.0 m
D) 19.5 m
E) 5.0 m
Correct Answer:

Verified
Correct Answer:
Verified
Q12: Arthur and Betty start walking toward each
Q39: FIGURE 2-6 <img src="https://d2lvgg3v3hfg70.cloudfront.net/TB3817/.jpg" alt="FIGURE 2-6
Q40: FIGURE 2-6 <img src="https://d2lvgg3v3hfg70.cloudfront.net/TB3817/.jpg" alt="FIGURE 2-6
Q42: Which graph below could represent the motion
Q43: FIGURE 2-8 <img src="https://d2lvgg3v3hfg70.cloudfront.net/TB3817/.jpg" alt="FIGURE 2-8
Q45: FIGURE 2-2 <img src="https://d2lvgg3v3hfg70.cloudfront.net/TB3817/.jpg" alt="FIGURE 2-2
Q46: FIGURE 2-8 <img src="https://d2lvgg3v3hfg70.cloudfront.net/TB3817/.jpg" alt="FIGURE 2-8
Q47: In a relay race, runner A is
Q48: FIGURE 2-13 <img src="https://d2lvgg3v3hfg70.cloudfront.net/TB3817/.jpg" alt="FIGURE 2-13
Q84: The average velocity of a car traveling