Multiple Choice
Use the graph to answer the question. 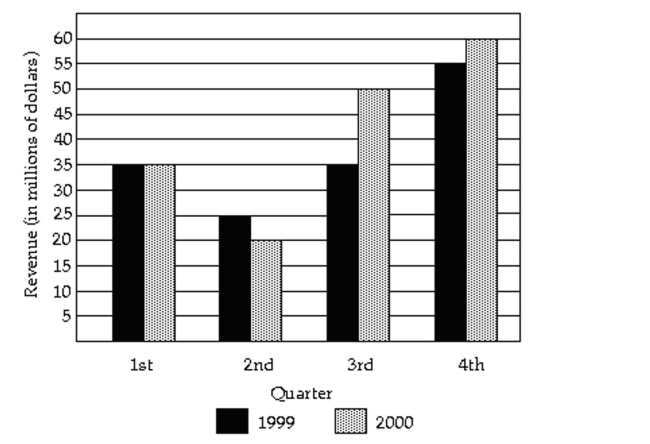
-What was the revenue for the fourth quarter of 2000
A) $60 million
B) $12 million
C) $55 million
D) $11 million
Correct Answer:

Verified
Correct Answer:
Verified
Related Questions
Q38: The class width is the difference between<br>A)
Q53: The 1995 payroll amounts for all
Q55: Describe What Can Make a Graph Misleading
Q56: Identify the Shape of a Distribution<br>-<img src="https://d2lvgg3v3hfg70.cloudfront.net/TB6005/.jpg"
Q57: Scott Tarnowski owns a pet grooming
Q59: Construct Frequency Polygons<br>- <span class="ql-formula" data-value="\begin{array}
Q60: The pie chart shows the percentage
Q61: The preschool children at Elmwood Elementary
Q62: The pie chart shows the percentage of
Q63: Describe What Can Make a Graph Misleading