Short Answer
Describe What Can Make a Graph Misleading or Deceptive
-A parcel delivery store finds that their delivery rates increased over the past year. Last year it delivered 3402 parcels. This year it delivered 8942 parcels. 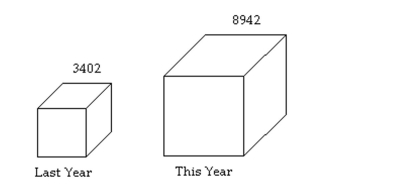 How many times larger should the graphic for this year be than the graphic for last year
Correct Answer:

Verified
roughly 3 ...View Answer
Unlock this answer now
Get Access to more Verified Answers free of charge
Correct Answer:
Verified
View Answer
Unlock this answer now
Get Access to more Verified Answers free of charge
Q58: Use the graph to answer the question.
Q59: Construct Frequency Polygons<br>- <span class="ql-formula" data-value="\begin{array}
Q60: The pie chart shows the percentage
Q61: The preschool children at Elmwood Elementary
Q62: The pie chart shows the percentage of
Q64: Construct Histograms of Continuous Data<br>- <span
Q65: The results of a survey about
Q66: Create Cumulative Frequency and Relative Frequency
Q67: Construct Histograms of Continuous Data<br>-The 30
Q68: Draw Stem-and-Leaf Plots<br>-The March utility bills