Multiple Choice
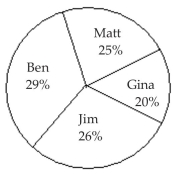
The pie chart shows the percentage of votes received by each candidate in the student council presidential election. Use
the pie chart to answer the question.
-Student Council President
300 total votes Who got the most votes
A) Ben
B) Jim
C) Matt
D) Gina
Correct Answer:

Verified
Correct Answer:
Verified
Q57: Scott Tarnowski owns a pet grooming
Q58: Use the graph to answer the question.
Q59: Construct Frequency Polygons<br>- <span class="ql-formula" data-value="\begin{array}
Q60: The pie chart shows the percentage
Q61: The preschool children at Elmwood Elementary
Q63: Describe What Can Make a Graph Misleading
Q64: Construct Histograms of Continuous Data<br>- <span
Q65: The results of a survey about
Q66: Create Cumulative Frequency and Relative Frequency
Q67: Construct Histograms of Continuous Data<br>-The 30