Essay
The bar charts below depict the MPAA movie ratings of 489 movies, separated by high and low critic scores. Which bar chart shows more variability in MPAA movie ratings? Why? 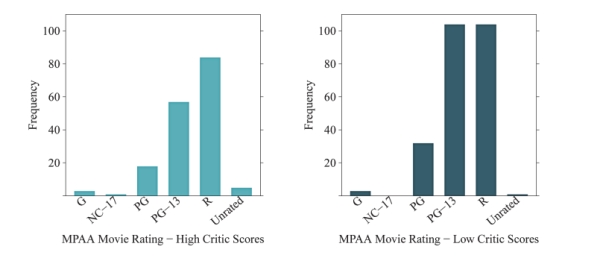
Correct Answer:

Verified
The "high critic scores" bar c...View Answer
Unlock this answer now
Get Access to more Verified Answers free of charge
Correct Answer:
Verified
View Answer
Unlock this answer now
Get Access to more Verified Answers free of charge
Q16: Use the following information to answer questions
Q17: How are individual observations recorded in a
Q18: Describe a scenario in which a distribution
Q19: The following histogram represents audience movie ratings
Q20: for following questions , match one of
Q22: The bar charts below depict the marital
Q23: Use the following information to answer questions
Q24: for following questions , match one of
Q25: The following histogram represents the number of
Q26: Use the following information to answer questions