Short Answer
for following questions , match one of the histograms below with its appropriate description.
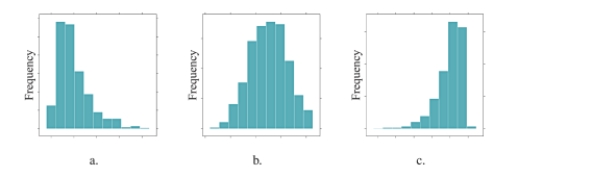
-The distribution of test scores for a group of students who received a 15-minute study session prior to taking a test is displayed in histogram .
Correct Answer:

Verified
Correct Answer:
Verified
Q15: for following questions , match one of
Q16: Use the following information to answer questions
Q17: How are individual observations recorded in a
Q18: Describe a scenario in which a distribution
Q19: The following histogram represents audience movie ratings
Q21: The bar charts below depict the MPAA
Q22: The bar charts below depict the marital
Q23: Use the following information to answer questions
Q24: for following questions , match one of
Q25: The following histogram represents the number of