Multiple Choice
The bar charts below depict the marital statuses of Americans, separated by gender. Which bar chart shows more variability in marital status? Why? 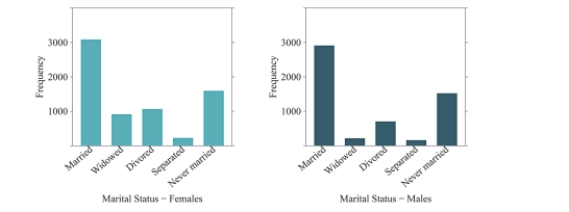
A) The female bar chart shows more variability because many of the observations fall into one category ("Married") .
B) The female bar chart shows more variability because there are more observations in the different categories than there are for males.
C) The male bar chart shows more variability because many of the observations fall into one category ("Married") .
D) The male bar chart shows more variability because there are more observations in the different categories than there are for females.
Correct Answer:

Verified
Correct Answer:
Verified
Q17: How are individual observations recorded in a
Q18: Describe a scenario in which a distribution
Q19: The following histogram represents audience movie ratings
Q20: for following questions , match one of
Q21: The bar charts below depict the MPAA
Q23: Use the following information to answer questions
Q24: for following questions , match one of
Q25: The following histogram represents the number of
Q26: Use the following information to answer questions
Q27: The two histograms below display the exact