Multiple Choice
The following table presents the number of police officers (per 100,000 citizens) and the annual murder rate (per 100,000 citizens) for a sample of cities. Construct a scatter plot of the per capita murder rate (y) versus the per capita number of police officers(x) )
A) 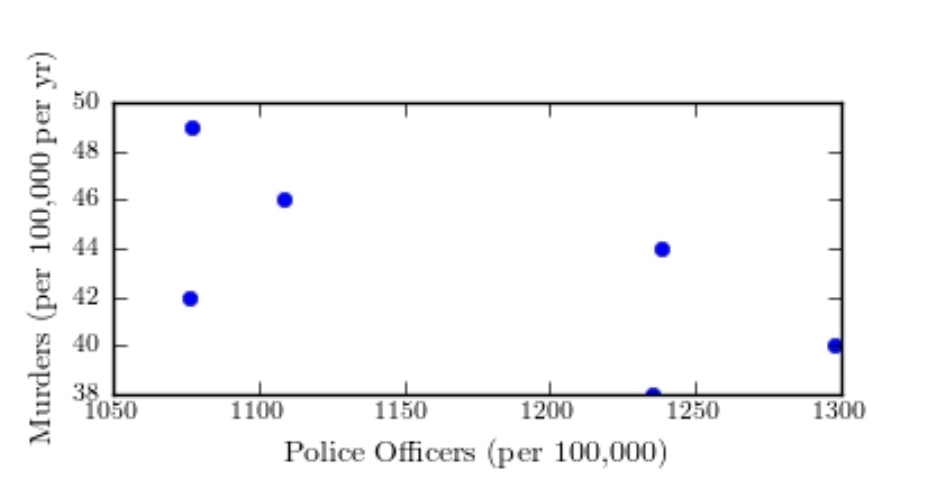
B) 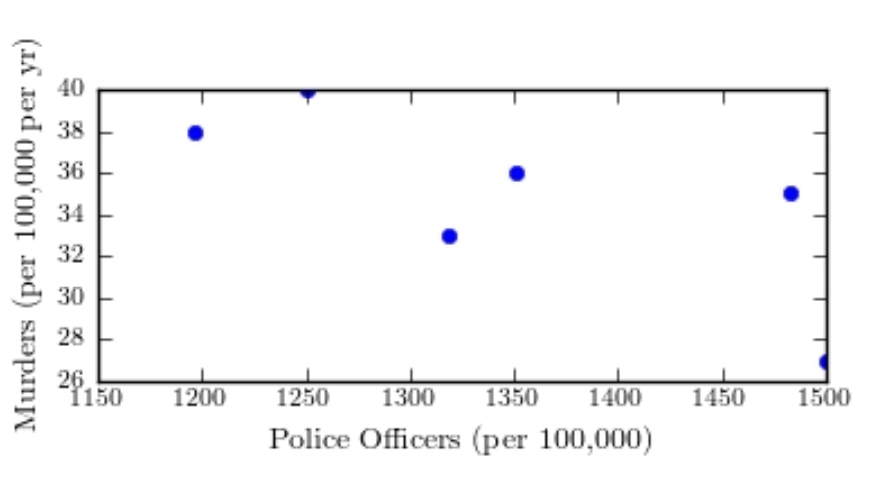
C) 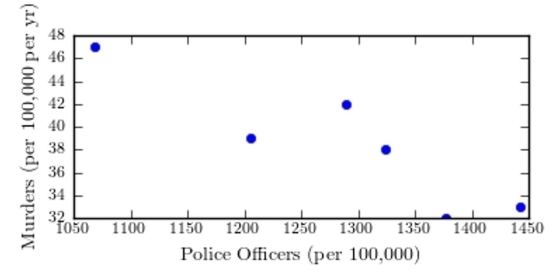
D) 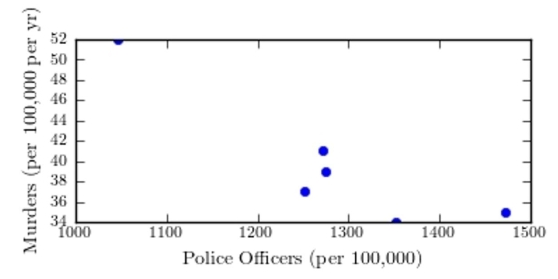
Correct Answer:

Verified
Correct Answer:
Verified
Related Questions
Q1: The following display from a graphing calculator
Q2: The following MINITAB output presents the
Q3: As with many other construction materials,
Q4: An automotive engineer computed a least-squares
Q6: One of the primary feeds for
Q7: The following table presents the average
Q8: Of points 1, 2, and 3 shown
Q9: Compute the least-squares regression line for
Q10: A blood pressure measurement consists of
Q11: One of the primary feeds for