Multiple Choice
The following display from a graphing calculator presents the least-squares regression line for predicting the price of a certain commodity (y) from the price of a barrel of oil (x) . 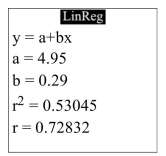 Predict the commodity price when oil costs $107 per barrel.
A) $62
B) $530
C) $83
D) $36
Correct Answer:

Verified
Correct Answer:
Verified
Related Questions
Q2: The following MINITAB output presents the
Q3: As with many other construction materials,
Q4: An automotive engineer computed a least-squares
Q5: The following table presents the number
Q6: One of the primary feeds for
Q7: The following table presents the average
Q8: Of points 1, 2, and 3 shown
Q9: Compute the least-squares regression line for
Q10: A blood pressure measurement consists of
Q11: One of the primary feeds for