Multiple Choice
As with many other construction materials, the price of gravel (per ton) depends on the quantity of material ordered. The following table presents the unit cost (dollars/ton) for gravel for various order sizes (in tons) .
Which of the following graphs is the correct residual plot for the data set? (Hint: create your own residual plot
And compare it to those shown below.)
A) 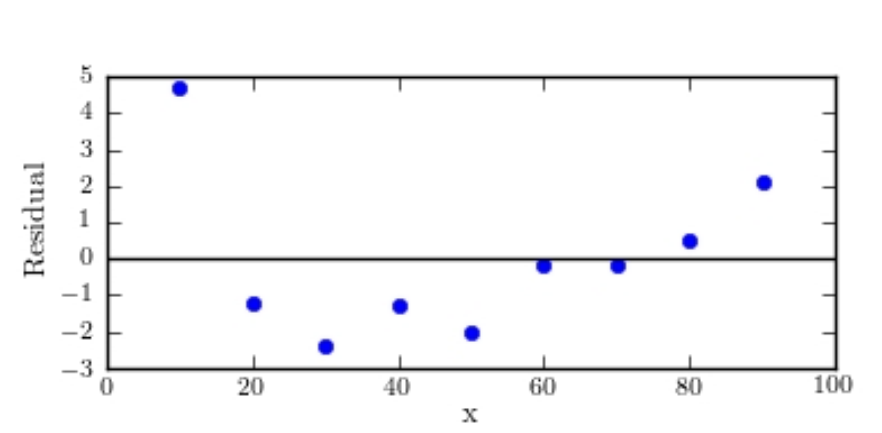
B) 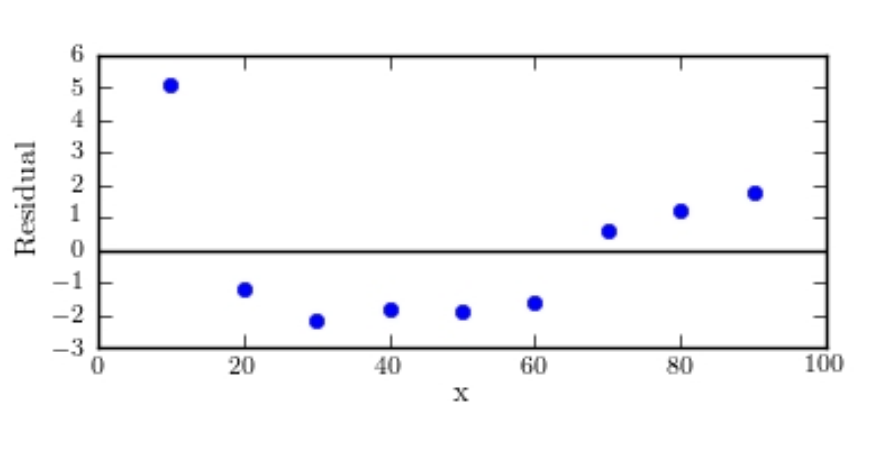
C) 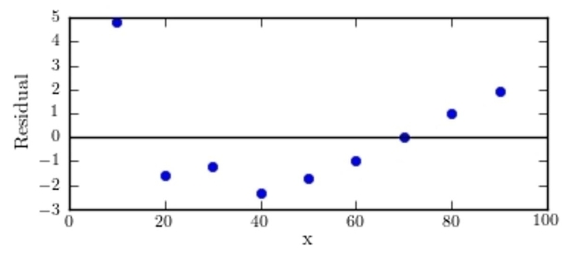
D) 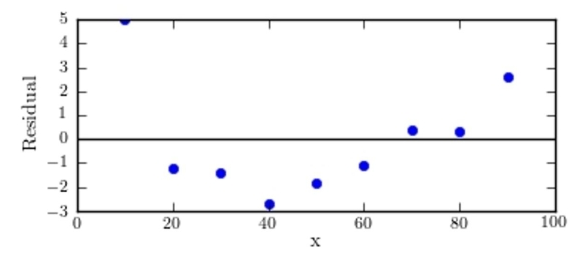
Correct Answer:

Verified
Correct Answer:
Verified
Q1: The following display from a graphing calculator
Q2: The following MINITAB output presents the
Q4: An automotive engineer computed a least-squares
Q5: The following table presents the number
Q6: One of the primary feeds for
Q7: The following table presents the average
Q8: Of points 1, 2, and 3 shown
Q9: Compute the least-squares regression line for
Q10: A blood pressure measurement consists of
Q11: One of the primary feeds for