Multiple Choice
The histogram below represents the number of television sets per household for a sample of U.S. households. What is the sample size? 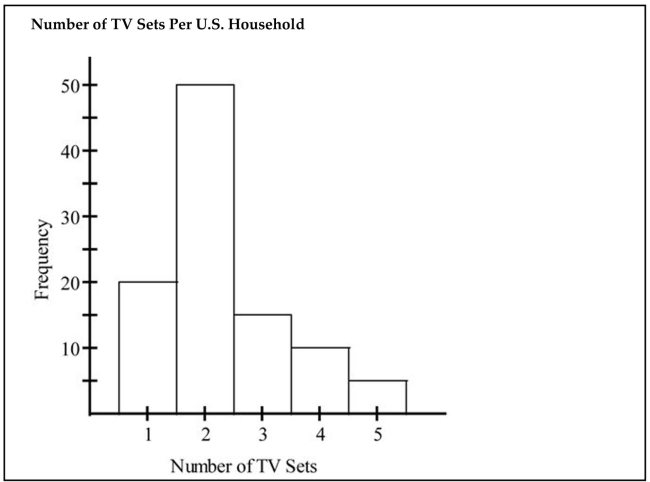
A) 100
B) 5
C) 90
D) 50
Correct Answer:

Verified
Correct Answer:
Verified
Related Questions
Q45: Describe at least two advantages to using
Q103: The linear _ coefficient denoted by r
Q104: Sturges' guideline suggests that when constructing a
Q105: Use the data to create a
Q107: The following data show the number
Q109: The histogram below shows the distribution of
Q110: The frequency distribution below summarizes employee
Q111: The following frequency distribution analyzes the
Q112: A nurse measured the blood pressure of
Q113: Which of the following cumulative frequency