Multiple Choice
The following data show the number of laps run by each participant in a marathon.
Which of these choices display the correct stemplot?
A) 
B) 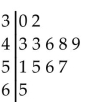
Correct Answer:

Verified
Correct Answer:
Verified
Related Questions
Q13: Graphs should be constructed in a way
Q45: Describe at least two advantages to using
Q103: The linear _ coefficient denoted by r
Q104: Sturges' guideline suggests that when constructing a
Q105: Use the data to create a
Q108: The histogram below represents the number of
Q109: The histogram below shows the distribution of
Q110: The frequency distribution below summarizes employee
Q111: The following frequency distribution analyzes the
Q112: A nurse measured the blood pressure of