Short Answer
The histogram below shows the distribution of the assets (in millions of dollars) of 71 companies. Does the
distribution appear to be normal? 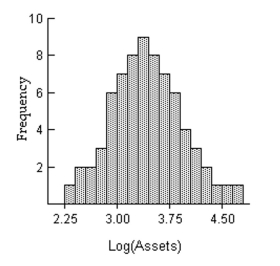
Correct Answer:

Verified
Yes, it ap...View Answer
Unlock this answer now
Get Access to more Verified Answers free of charge
Correct Answer:
Verified
Yes, it ap...
View Answer
Unlock this answer now
Get Access to more Verified Answers free of charge
Related Questions
Q45: Describe at least two advantages to using
Q104: Sturges' guideline suggests that when constructing a
Q105: Use the data to create a
Q107: The following data show the number
Q108: The histogram below represents the number of
Q110: The frequency distribution below summarizes employee
Q111: The following frequency distribution analyzes the
Q112: A nurse measured the blood pressure of
Q113: Which of the following cumulative frequency
Q114: On a math test, the scores