Essay
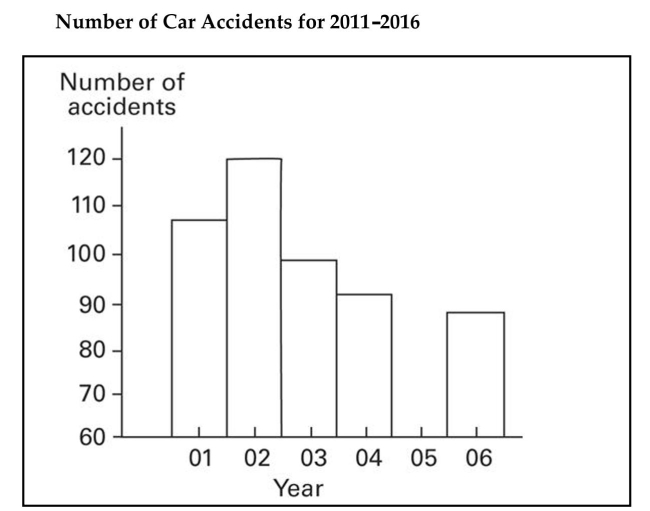
The graph below shows the number of car accidents occurring in one city in each of the years 2011 through
2016. The number of accidents dropped in 2013 after a new speed limit was imposed. Does the graph distort the
data? How would you redesign the graph to be less misleading? 
Correct Answer:

Verified
The graph distorts the data because the ...View Answer
Unlock this answer now
Get Access to more Verified Answers free of charge
Correct Answer:
Verified
View Answer
Unlock this answer now
Get Access to more Verified Answers free of charge
Q90: The frequency distribution below summarizes employee
Q91: The following frequency distribution displays the
Q92: Use the data to create a
Q93: Solve the problem.<br>-120 casino patrons, were interviewed
Q94: The following figures represent Jennifer's monthly
Q96: The frequency table below shows the
Q97: The Kappa Iota Sigma Fraternity polled its
Q98: Solve the problem.<br>-A car dealer is
Q99: A manufacturer records the number of
Q100: <img src="https://d2lvgg3v3hfg70.cloudfront.net/TB7898/.jpg" alt="