Multiple Choice
Solve the problem.
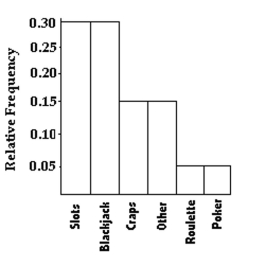
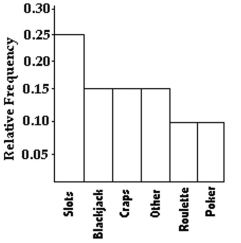
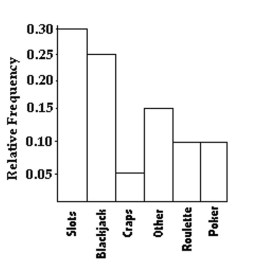
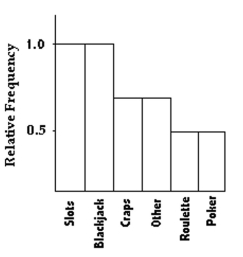
-120 casino patrons, were interviewed as they left the casino. 36 of them said they spent most of the time playing the slots. 36 of them said they played blackjack. 18 said they played craps. 6 said roulette. 6 said poker. The rest
Were not sure what they played the most. Construct a Pareto chart to depict the gaming practices of the group of
Casino goers. Choose the vertical scale so that the relative frequencies are represented. 
A) 
B) 
C) 
D) 
Correct Answer:

Verified
Correct Answer:
Verified
Q88: The following frequency distribution depicts the
Q89: Use the data to create a
Q90: The frequency distribution below summarizes employee
Q91: The following frequency distribution displays the
Q92: Use the data to create a
Q94: The following figures represent Jennifer's monthly
Q95: The graph below shows the number of
Q96: The frequency table below shows the
Q97: The Kappa Iota Sigma Fraternity polled its
Q98: Solve the problem.<br>-A car dealer is