Multiple Choice
Solve the problem.
-A car dealer is deciding what kinds of vehicles he should order from the factory. He looks at his sales report for the preceding period. Choose the vertical scale so that the relative frequencies are represented. 
Construct a Pareto chart to help him decide.
A) 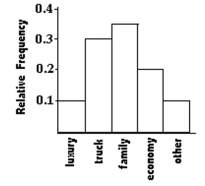
B) 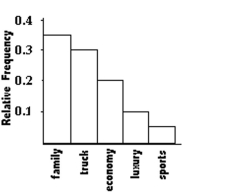
C) 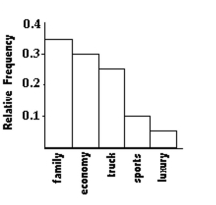
D) 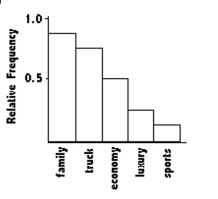
Correct Answer:

Verified
Correct Answer:
Verified
Q13: Graphs should be constructed in a way
Q93: Solve the problem.<br>-120 casino patrons, were interviewed
Q94: The following figures represent Jennifer's monthly
Q95: The graph below shows the number of
Q96: The frequency table below shows the
Q97: The Kappa Iota Sigma Fraternity polled its
Q99: A manufacturer records the number of
Q100: <img src="https://d2lvgg3v3hfg70.cloudfront.net/TB7898/.jpg" alt="
Q101: Construct a pie chart representing the
Q103: The linear _ coefficient denoted by r