Multiple Choice
A nurse measured the blood pressure of each person who visited her clinic. Following is a relative-frequency histogram for the systolic blood pressure readings for those people aged between 25 and 40. The blood pressure
Readings were given to the nearest whole number. Identify the center of the third class. 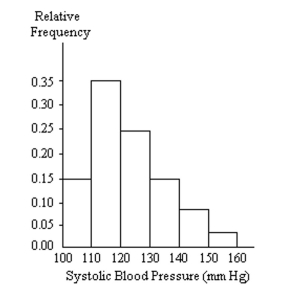
A) 125
B) 130
C) 124
D) 120
Correct Answer:

Verified
Correct Answer:
Verified
Q17: Use the high closing values of
Q18: In a survey, 26 voters were
Q19: The histogram below represents the number of
Q20: <span class="ql-formula" data-value="\begin{array}{c|c}\text { Speed } &
Q21: The frequency distribution below summarizes the
Q23: The frequency distribution below summarizes the
Q24: Construct a pie chart representing the given
Q25: In a survey, 20 people were
Q26: The frequency distribution below summarizes the
Q27: In a survey, 26 voters were