Multiple Choice
The histogram below represents the number of television sets per household for a sample of U.S. households. How many households are included in the histogram? 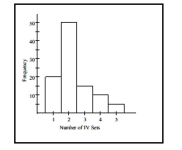
A) 95
B) 110
C) 90
D) 100
Correct Answer:

Verified
Correct Answer:
Verified
Related Questions
Q14: <span class="ql-formula" data-value="\begin{array} { r r r
Q15: Construct a pie chart representing the
Q16: The frequency distribution for the weekly
Q17: Use the high closing values of
Q18: In a survey, 26 voters were
Q20: <span class="ql-formula" data-value="\begin{array}{c|c}\text { Speed } &
Q21: The frequency distribution below summarizes the
Q22: A nurse measured the blood pressure of
Q23: The frequency distribution below summarizes the
Q24: Construct a pie chart representing the given