Multiple Choice
The histogram below represents the number of television sets per household for a sample of U.S. households. What is the class width? 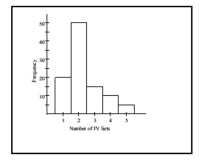
A) 5
B) 0.5
C) 1
D) 2
Correct Answer:

Verified
Correct Answer:
Verified
Related Questions
Q50: Explain in your own words why a
Q57: Describe how a data point labeled as
Q73: The frequency distribution below summarizes employee
Q74: Construct a pie chart representing the
Q75: The attendance counts for this season's
Q77: Use the data to create a
Q78: Which choice displays the best graphic
Q79: The data shows the roundtrip mileage
Q80: Solve the problem.<br>-At the National Criminologists
Q81: A store manager counts the number