menu-iconExamlexExamLexServices

Discover

Ask a Question
  1. All Topics
  2. Topic
    Statistics
  3. Study Set
    Elementary Statistics
  4. Exam
    Exam 2: Exploring Data With Tables and Graphs
  5. Question
    A) B)C)D)
Solved

A) B)C)D)

Question 2

Question 2

Multiple Choice

   A)     B)     C)     D)


A)
   A)     B)     C)     D)

B)
   A)     B)     C)     D)

C)
   A)     B)     C)     D)

D)
   A)     B)     C)     D)

Correct Answer:

verifed

Verified

Related Questions

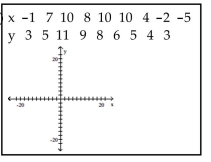
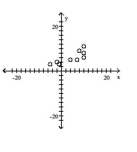
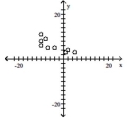
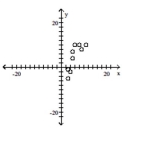
Q1: Use the data to create a

Q3: According to USA Today, the largest categories

Q4: A school district performed a study

Q6: Consider the frequency distribution below, which

Q7: Construct a pie chart representing the given

Q8: Kevin asked some of his friends

Q9: Consider the frequency distribution below, which

Q10: The frequency distribution below summarizes the

Q11: Construct a pie chart representing the given

Q34: A bar chart and a Pareto chart

Examlex

ExamLex

About UsContact UsPerks CenterHomeschoolingTest Prep

Work With Us

Campus RepresentativeInfluencers

Links

FaqPricingChrome Extension

Download The App

Get App StoreGet Google Play

Policies

Privacy PolicyTerms of ServiceHonor CodeCommunity Guidelines

Scan To Download

qr-code

Copyright © (2025) ExamLex LLC.

Privacy PolicyTerms Of ServiceHonor CodeCommunity Guidelines