Multiple Choice
Construct a pie chart representing the given data set.
-The following figures give the distribution of land (in acres) for a county containing 71,000 acres. 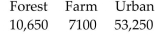

A) 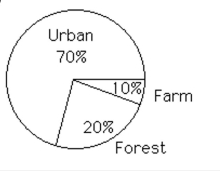
B) 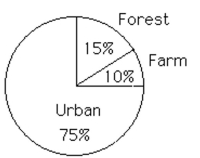
Correct Answer:

Verified
Correct Answer:
Verified
Related Questions
Q2: <img src="https://d2lvgg3v3hfg70.cloudfront.net/TB7898/.jpg" alt=" A)
Q3: According to USA Today, the largest categories
Q4: A school district performed a study
Q6: Consider the frequency distribution below, which
Q8: Kevin asked some of his friends
Q9: Consider the frequency distribution below, which
Q10: The frequency distribution below summarizes the
Q11: Construct a pie chart representing the given
Q12: Analysis of the data from 25
Q34: A bar chart and a Pareto chart