Essay
Construct a run chart for individual values corresponding to the given data. A machine is supposed to fill boxes
to a weight of 50 pounds. Every 30 minutes a sample of four boxes is tested; the results are given below. 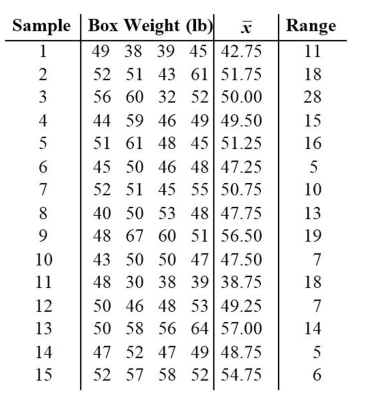
Correct Answer:

Verified
Correct Answer:
Verified
Related Questions
Q21: Are control charts based on actual behavior
Q57: A run chart for individual values is
Q58: Examine the given run chart or control
Q59: A run chart for individual values is
Q60: A control chart for R is shown
Q61: Examine the given run chart or control
Q63: A control chart for <span
Q65: Construct an R chart and determine whether
Q66: Use the given process data to
Q67: A machine is supposed to fill cans