Essay
A machine is supposed to fill cans that contain 12 ounces. Each hour, a sample of four cans is tested; the results
of 15 consecutive hours are given below. 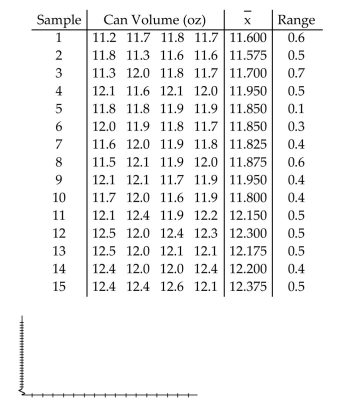
Correct Answer:

Verified
Correct Answer:
Verified
Related Questions
Q21: Are control charts based on actual behavior
Q62: Construct a run chart for individual values
Q63: A control chart for <span
Q65: Construct an R chart and determine whether
Q66: Use the given process data to
Q68: A machine that is supposed to fill
Q69: Control charts are used to monitor changing
Q70: Use the given process data to
Q71: A machine is supposed to fill cans
Q72: _ variation results from causes that can