Essay
Construct an R chart and determine whether the process variation is within statistical control. 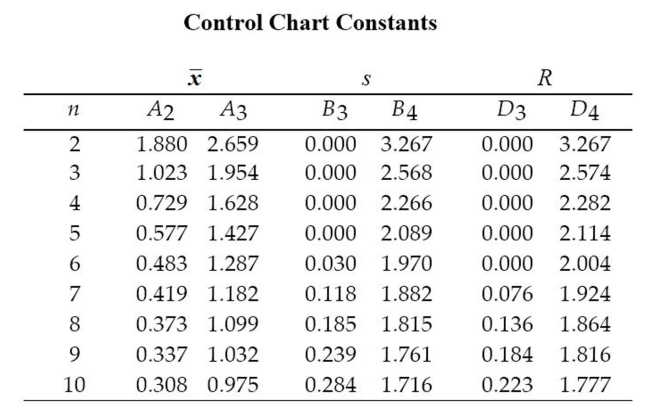 A machine that is supposed to produce ball bearings with a diameter of 7 millimeters yields the following data from a
test of 5 ball bearings every 20 minutes. 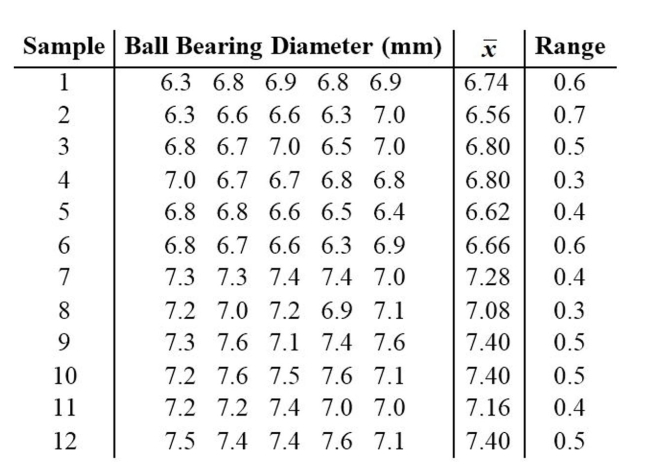
Correct Answer:

Verified
The process appears ...View Answer
Unlock this answer now
Get Access to more Verified Answers free of charge
Correct Answer:
Verified
View Answer
Unlock this answer now
Get Access to more Verified Answers free of charge
Q21: Are control charts based on actual behavior
Q60: A control chart for R is shown
Q61: Examine the given run chart or control
Q62: Construct a run chart for individual values
Q63: A control chart for <span
Q66: Use the given process data to
Q67: A machine is supposed to fill cans
Q68: A machine that is supposed to fill
Q69: Control charts are used to monitor changing
Q70: Use the given process data to