Multiple Choice
Examine the given run chart or control chart and determine whether the process is within statistical control. 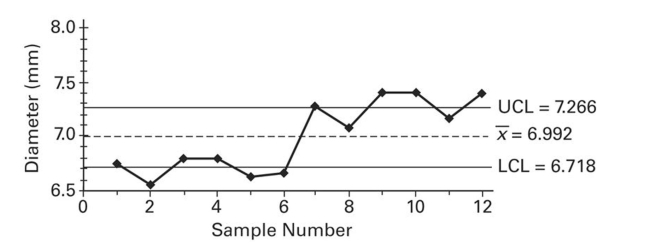
A) The process is within statistical control.
B) The process is not within statistical control.
Correct Answer:

Verified
Correct Answer:
Verified
Q11: Solve the Problem.<br>-A control chart for attributes
Q23: Match the chart with its characteristic.
Q24: Which graph using individual data values
Q25: <img src="https://d2lvgg3v3hfg70.cloudfront.net/TB7898/.jpg" alt=" " class="answers-bank-image d-block" rel="preload"
Q27: A manufacturer of lightbulbs picks 10
Q29: A control chart for R is shown
Q30: A machine that is supposed to fill
Q31: A control chart for <span
Q32: <img src="https://d2lvgg3v3hfg70.cloudfront.net/TB7898/.jpg" alt=" " class="answers-bank-image d-block" rel="preload"
Q52: Describe a run chart and give an