Multiple Choice
A manufacturer of lightbulbs picks 10 lightbulbs at random each day for quality control. The mean and range (in hours) of the lifetimes of the 10 lightbulbs are calculated. The results for 12 consecutive days are shown in
The table below. Construct an R chart to determine whether the process is in statistical control. 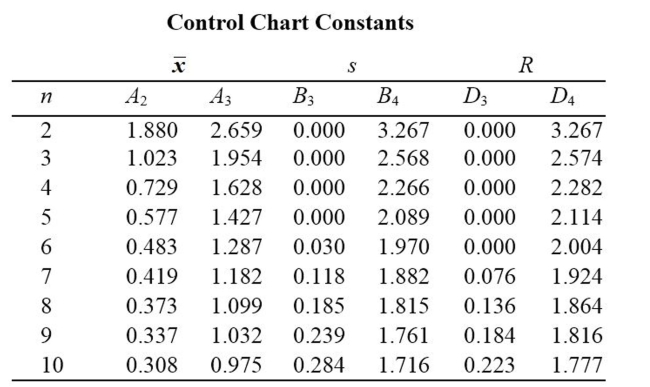
A) The process is not within statistical control.
B) The process is within statistical control.
Correct Answer:

Verified
Correct Answer:
Verified
Q11: Solve the Problem.<br>-A control chart for attributes
Q22: Which type of chart would be
Q23: Match the chart with its characteristic.
Q24: Which graph using individual data values
Q25: <img src="https://d2lvgg3v3hfg70.cloudfront.net/TB7898/.jpg" alt=" " class="answers-bank-image d-block" rel="preload"
Q28: Examine the given run chart or control
Q29: A control chart for R is shown
Q30: A machine that is supposed to fill
Q31: A control chart for <span
Q32: <img src="https://d2lvgg3v3hfg70.cloudfront.net/TB7898/.jpg" alt=" " class="answers-bank-image d-block" rel="preload"