Multiple Choice
Below is a histogram of salaries (in $) for a sample of U.S.marketing managers. 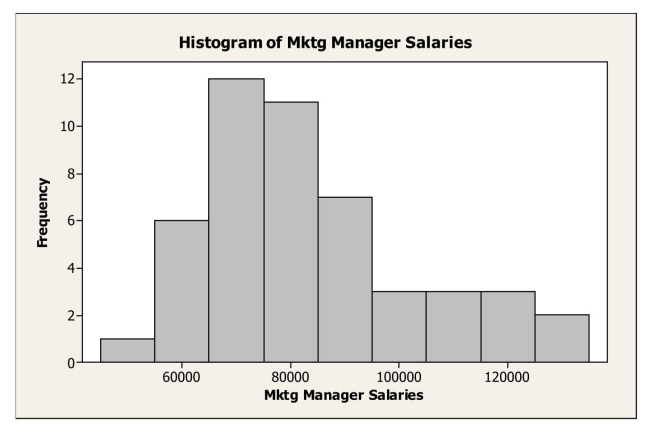 The most appropriate measure of central tendency for these data is the
A) median.
B) mean.
C) mode.
D) range.
E) standard deviation.
Correct Answer:

Verified
Correct Answer:
Verified
Related Questions
Q3: The following boxplots show monthly sales revenue
Q4: The following boxplots show monthly sales revenue
Q5: The following table shows closing share prices
Q6: The following table shows total assets ($
Q7: The following table shows closing share prices
Q9: Consider the five number summary for salaries
Q10: The following table shows closing share prices
Q11: The following table shows total assets ($
Q12: The following table shows total assets ($
Q13: Consider the five number summary of hourly