Multiple Choice
The following table shows closing share prices for a small sample of companies. 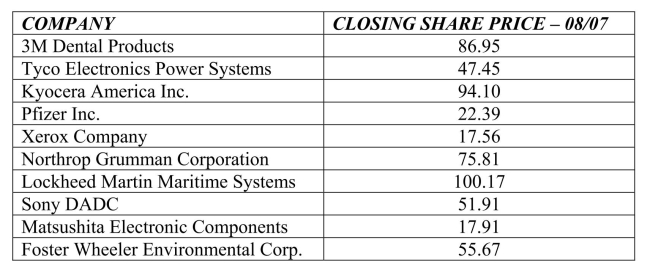 The standard deviation in closing share prices is
A) $31.43.
B) $44.65.
C) $56.99.
D) $62.19.
E) $75.77.
Correct Answer:

Verified
Correct Answer:
Verified
Related Questions
Q5: The following table shows closing share prices
Q5: The ASQ (American Society for Quality) regularly
Q6: The following table shows total assets ($
Q7: The following table shows closing share prices
Q8: Below is a histogram of salaries (in
Q9: Consider the five number summary for salaries
Q11: The following table shows total assets ($
Q12: The following table shows total assets ($
Q13: Consider the five number summary of hourly
Q15: Below is a histogram of salaries (in