Multiple Choice
The following table shows total assets ($ billion) for a small sample of U.S.banks. 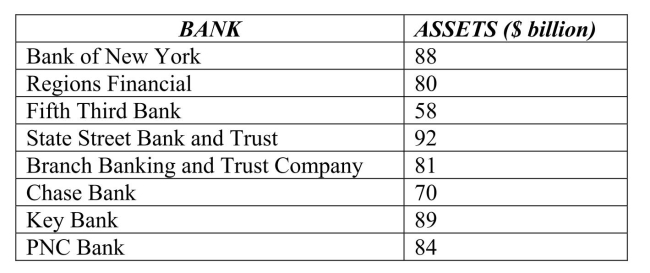 The standard deviation for these data is
A) $12.78 billion.
B) $ 11.27 billion.
C) $ 127.01 billion.
D) $ 21.67 billion.
E) $ 34 billion.
Correct Answer:

Verified
Correct Answer:
Verified
Related Questions
Q5: The ASQ (American Society for Quality) regularly
Q6: The following table shows total assets ($
Q7: The following table shows closing share prices
Q8: Below is a histogram of salaries (in
Q9: Consider the five number summary for salaries
Q10: The following table shows closing share prices
Q12: The following table shows total assets ($
Q13: Consider the five number summary of hourly
Q15: Below is a histogram of salaries (in
Q16: Consider the five number summary of hourly