Essay
(Table: Changes in the National Debt) (This question is for those instructors who have spent some time in class discussing the evolution of the national debt, and the history of the federal budget deficits and surpluses.) 
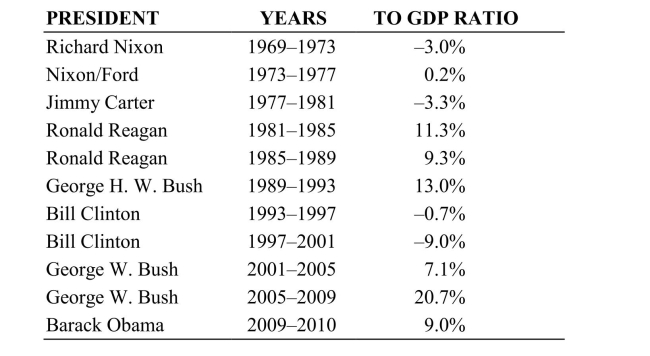 The chart (adapted from a chart on Wikipedia developed from the budget for the fiscal 2012 year) shows the change in federal debt by president, and the years of each administration. What helps to explain some of the increase seen in the Reagan years?
Correct Answer:

Verified
Correct Answer:
Verified
Q2: Figure: U.S. Marginal and Average Tax Rates
Q5: <img src="https://d2lvgg3v3hfg70.cloudfront.net/TB3375/.jpg" alt=" In this table,
Q6: Suppose the tax rate on the first
Q8: <img src="https://d2lvgg3v3hfg70.cloudfront.net/TB3375/.jpg" alt=" Reference: Ref 17-1
Q9: Taxpayers in the United States for the
Q10: This table shows data on taxes paid
Q42: Social Security benefits have become less generous
Q75: Since 1960,marginal tax rates in the United
Q165: The legislation Congress passed in 1969 to
Q267: Workers bear at least a majority, if