Short Answer
TABLE 2-10
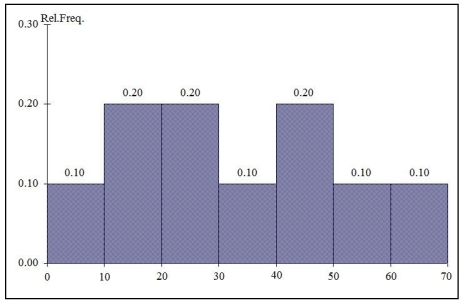
The histogram below represents scores achieved by 200 job applicants on a personality profile.

-Referring to the histogram from Table 2-10, the number of job applicants who scored between 30 and below 60 is ________.
Correct Answer:

Verified
Correct Answer:
Verified
Q13: Apple Computer, Inc. collected information on the
Q14: TABLE 2-9<br>The frequency distribution below represents the
Q15: TABLE 2-18<br>The stem-and-leaf display below shows the
Q17: TABLE 2-14<br>The table below contains the number
Q19: TABLE 2-13<br>Given below is the stem-and-leaf display
Q20: TABLE 2-14<br>The table below contains the number
Q21: TABLE 2-6<br>A sample of 200 students at
Q22: TABLE 2-11<br>The ordered array below resulted from
Q43: The stem-and-leaf display is often superior to
Q168: When comparing two or more large sets