Short Answer
TABLE 2-9
The frequency distribution below represents the rents of 250 randomly selected federally subsidized apartments in a small town.
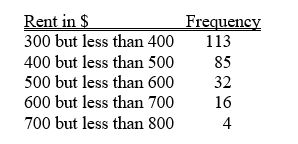
-Referring to Table 2-9, ________ percent of the apartments rented for at least $500.
Correct Answer:

Verified
Correct Answer:
Verified
Q9: TABLE 2-7<br>The Stem-and-Leaf display below contains data
Q10: TABLE 2-7<br>The Stem-and-Leaf display below contains data
Q12: Given below is the scatter plot of
Q13: Apple Computer, Inc. collected information on the
Q14: In general,grouped frequency distributions should have between
Q15: TABLE 2-18<br>The stem-and-leaf display below shows the
Q17: TABLE 2-14<br>The table below contains the number
Q18: TABLE 2-10<br>The histogram below represents scores achieved
Q19: TABLE 2-13<br>Given below is the stem-and-leaf display
Q43: The stem-and-leaf display is often superior to